Dam Engineering Design
RCC gravity · FSL 1,435m · 45m height · 970m crest · 90.9 Mm³ storage · pre-feasibility ±30%
Pre-Feasibility Engineering Drawings
Four panels computed from the 30m Copernicus DEM and 90m catchment DEM: valley cross-section at dam axis · RCC gravity dam cross-section · reservoir hypsometric (area- and volume-elevation curves) · net yield vs FSL sensitivity analysis.
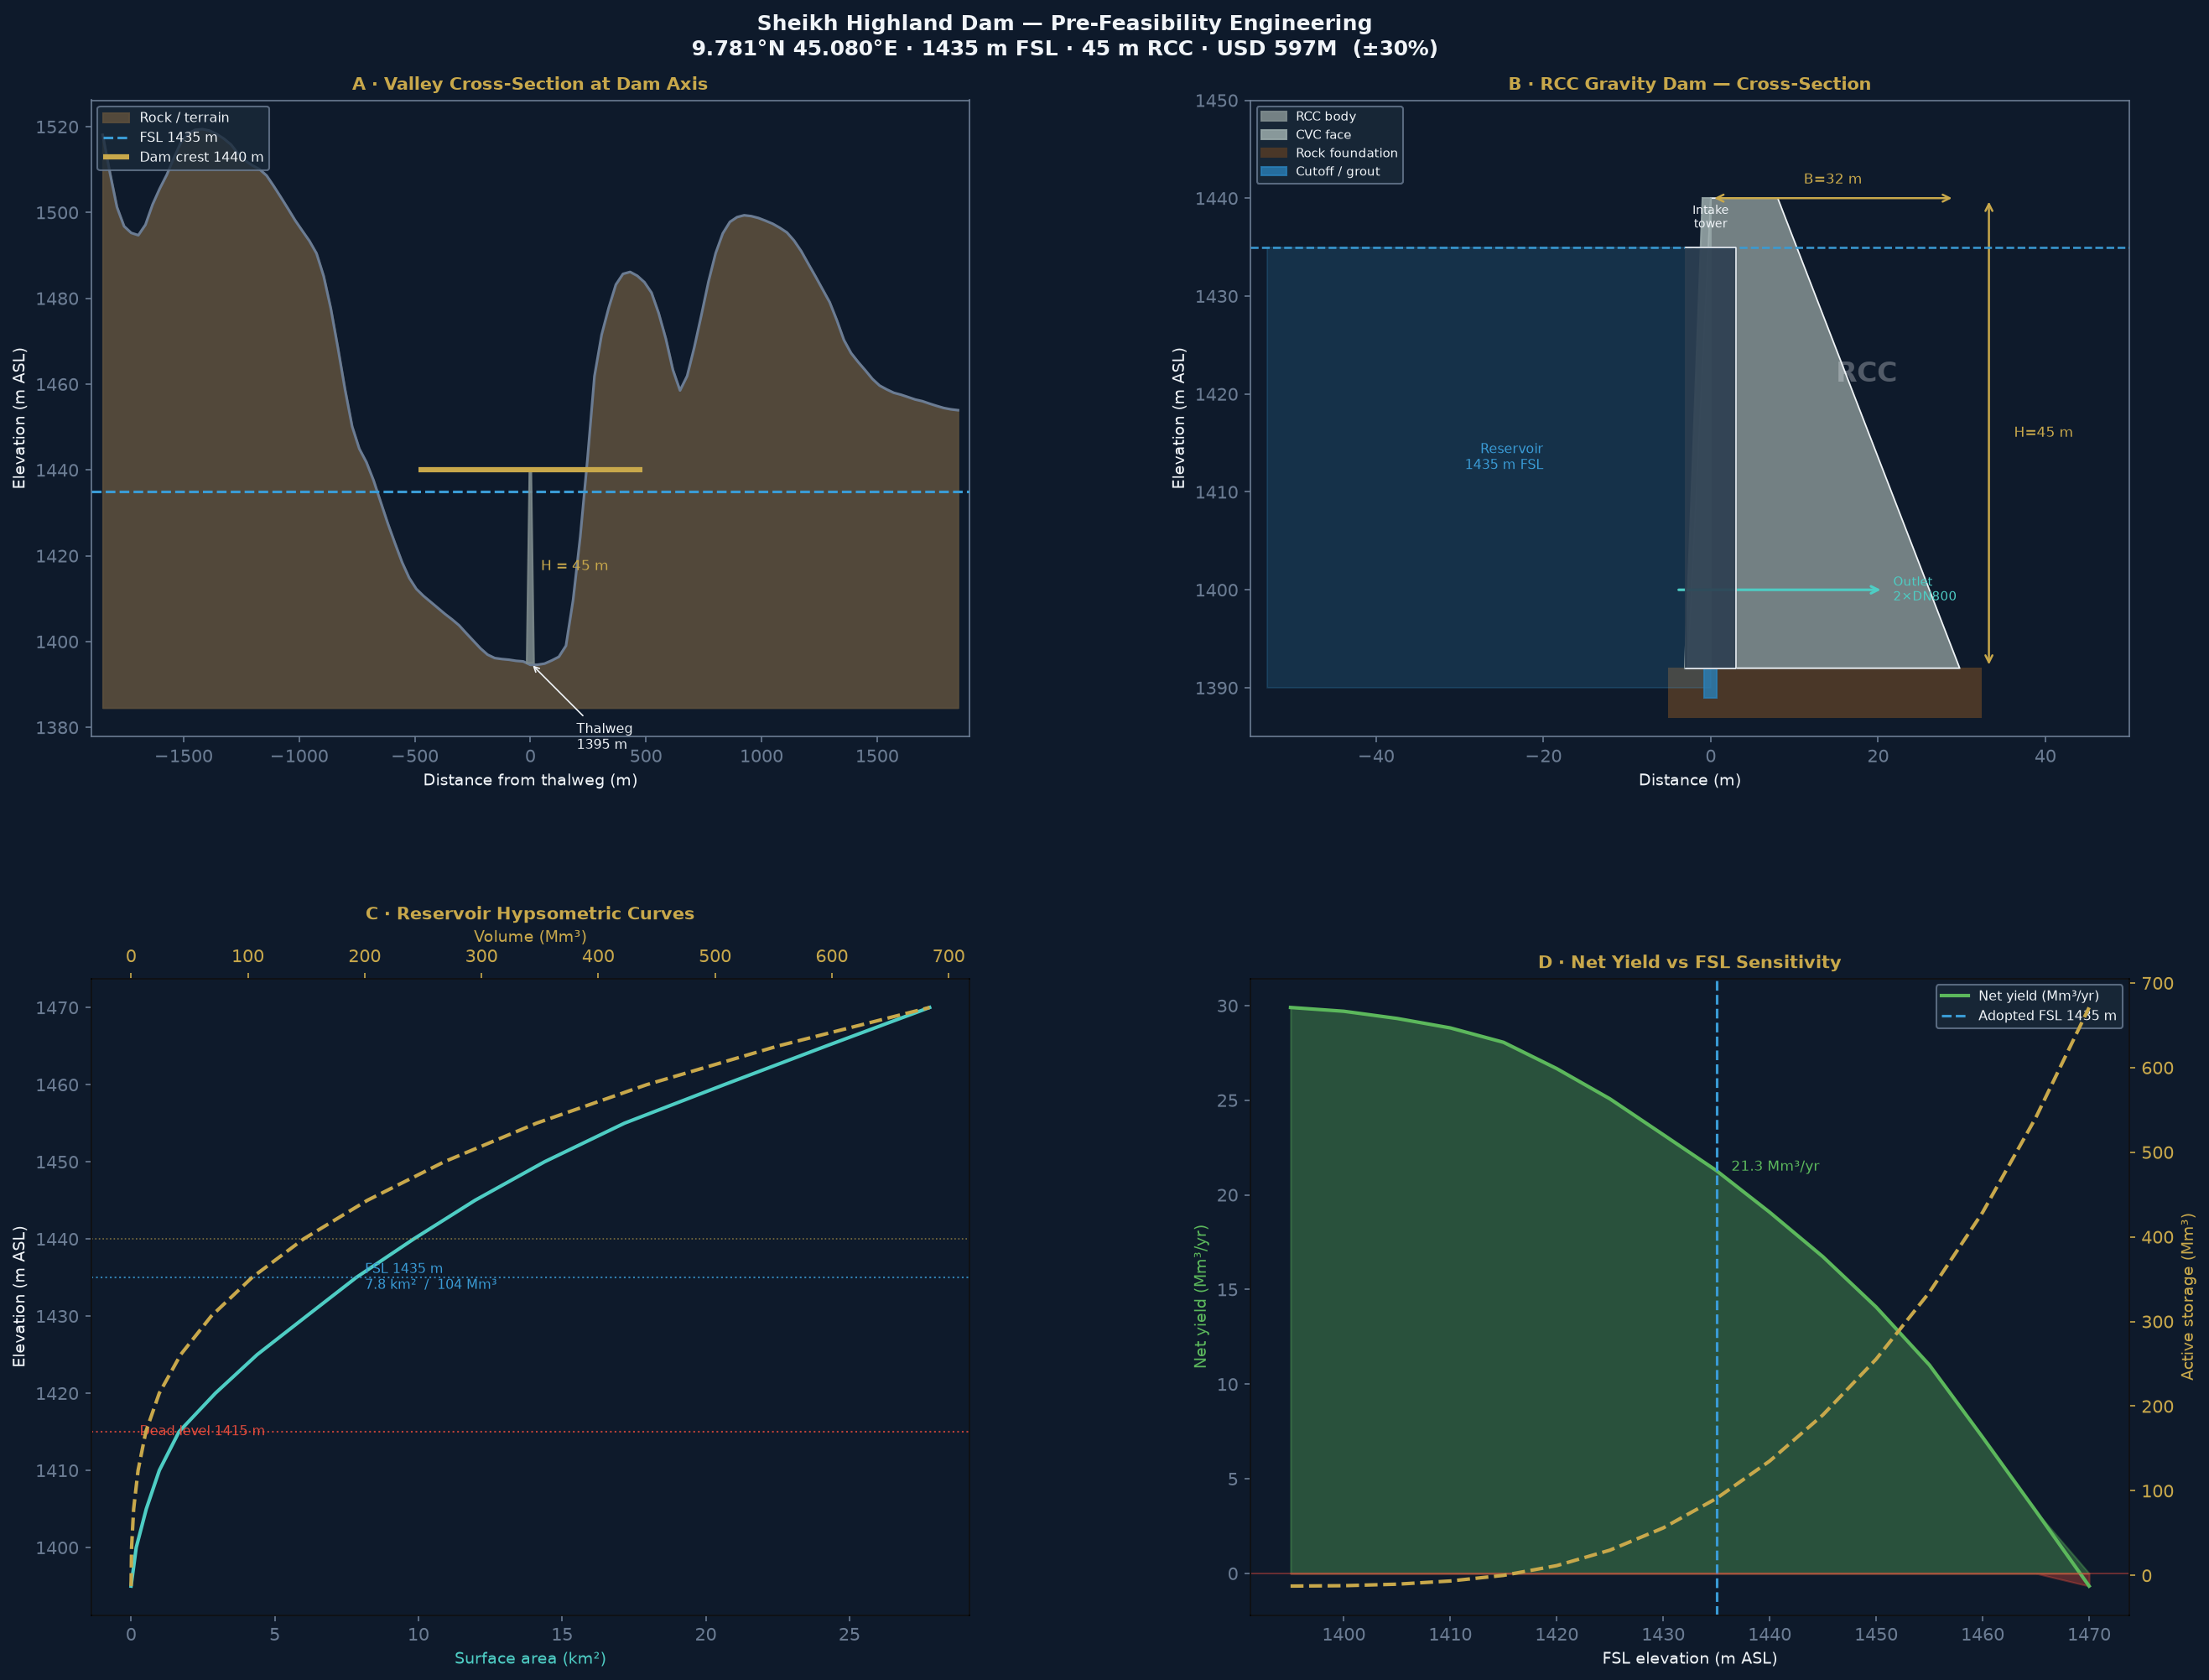
NB17 · Generated Oct 2026 · 30m Copernicus GLO-30 DEM · 90m corridor clip · pysheds DAM-01 catchment
Valley Cross-Section at Dam Axis
30m Copernicus DEM scanned ±3.1 km E–W across the valley at 9.781°N. The valley is asymmetric V-shape: gentle west slope (~1V:7H) formed by a broad highland plateau, steeper east slope (~1V:3H) where the Golis Range escarpment rises sharply.
| Height above thalweg | Water level (m ASL) | Valley width |
|---|---|---|
| +10 m | 1,405 m | 493 m |
| +20 m | 1,415 m (dead storage level) | 709 m |
| +30 m | 1,425 m | 832 m |
| +40 m | 1,435 m = FSL | 894 m |
| +45 m | 1,440 m = crest | 913 m |
| +50 m | 1,445 m | 987 m |
| +70 m | 1,465 m | 1,110 m |
Why RCC Gravity Dam
The Golis Range at 1,400 m ASL is Precambrian basement complex — excellent foundation bearing capacity and nearby quarry for aggregate. No soft valley alluvium.
Valley width at FSL is 894 m. Width/height ratio = 894/40 = 22 — too wide for an arch dam (requires W/H < 4). Gravity or embankment only.
An earthfill dam (1V:3H slopes) at 894 m width and 45 m height requires ~16 Mm³ of fill vs 0.86 Mm³ of RCC. Remote site logistics favour the more compact RCC option.
Somaliland dry season (October–February) gives a 5-month construction window without river diversion issues. RCC continuous-pour is faster than embankment compaction.
Reservoir: Area, Volume & Evaporation
| FSL (m) | Height (m) | Area (km²) | Volume (Mm³) | Evap loss | Net yield |
|---|---|---|---|---|---|
| 1,405 | +10 | 0.53 | 2.2 | 0.6 Mm³/yr | 29.3 Mm³/yr |
| 1,415 | +20 (dead) | 1.67 | 12.6 | 1.8 Mm³/yr | 28.1 Mm³/yr |
| 1,420 | +25 | 2.93 | 24.2 | 3.2 Mm³/yr | 26.7 Mm³/yr |
| 1,425 | +30 | 4.39 | 42.5 | 4.8 Mm³/yr | 25.1 Mm³/yr |
| 1,430 | +35 | 6.11 | 68.7 | 6.7 Mm³/yr | 23.2 Mm³/yr |
| 1,435 ✓ | +40 (FSL) | 7.84 | 103.6 | 8.6 Mm³/yr | 21.3 Mm³/yr |
| 1,440 | +45 | 9.84 | 147.8 | 10.8 Mm³/yr | 19.1 Mm³/yr |
| 1,445 | +50 | 11.97 | 202.3 | 13.2 Mm³/yr | 16.7 Mm³/yr |
| 1,465 | +70 | 24.19 | 553.7 | 26.6 Mm³/yr | 3.3 Mm³/yr |
A larger reservoir always has lower net yield because every extra km² of water surface loses ~1.1 m/yr to net evaporation. At FSL = 1,465 m the reservoir is 24 km² and loses 26.6 Mm³/yr — nearly all of the 29.9 Mm³/yr inflow. The recommended FSL = 1,435 m balances storage (90 Mm³, 3-year drought cover) against delivery (21 Mm³/yr net).
The reservoir area/volume curve uses the 90m DEM clipped to the pysheds DAM-01 catchment (439 km²). At 90m resolution the reservoir boundary is approximate (±500m at the upstream limit). LiDAR/UAV survey (5cm DTM, ToR B) will refine this by ±10–15% at bankable feasibility stage.
Rainfall & Runoff — Data Sources and Uncertainty
The project has two independent satellite rainfall datasets that disagree by 18%. The runoff coefficient (CN) — the fraction of rainfall that becomes streamflow — has not been measured; no stream gauge exists on the Sheikh River. The table below shows Gross MAR across the full plausible range. The design uses GPM IMERG × CN=0.20 (yellow row). All other rows represent genuine uncertainty.
/data/gpm_imerg_annual_climatology.csv/data/chirps_annual_2000_2023.csv| CN | Terrain description | MAR — GPM 341mm | MAR — CHIRPS 403mm |
|---|---|---|---|
| 0.10 | Karst limestone, deep percolation | 14.9 Mm³/yr | 17.7 Mm³/yr |
| 0.15 | Sparse semi-arid shrubland (lower bound) | 22.4 Mm³/yr | 26.5 Mm³/yr |
| 0.20 ★ | FAO semi-arid standard (design basis) | 29.9 Mm³/yr | 35.4 Mm³/yr |
| 0.30 | Rocky Highland, sparse cover | 44.9 Mm³/yr | 53.1 Mm³/yr |
| 0.40 | Highland grassland, thin soils | 59.9 Mm³/yr | 70.8 Mm³/yr |
| CN | Net yield — GPM | Net yield — CHIRPS | Covers Phase 2 demand? |
|---|---|---|---|
| 0.10 | 6.3 Mm³/yr | 9.1 Mm³/yr | ✗ Deficit −15 Mm³/yr |
| 0.15 | 13.8 Mm³/yr | 17.9 Mm³/yr | ✗ Short −7 to −3 Mm³/yr |
| 0.20 ★ | 21.3 Mm³/yr | 26.8 Mm³/yr | ✓ Just meets / exceeds |
| 0.30 | 36.3 Mm³/yr | 44.5 Mm³/yr | ✓ Comfortable surplus |
| 0.40 | 51.3 Mm³/yr | 62.2 Mm³/yr | ✓ Large surplus |
At CN=0.20 / GPM, net yield (21.3 Mm³/yr) exactly equals Phase 2 agricultural demand. There is zero carry-over margin if CN is 0.15 or lower. The Golis Range is partly limestone — karst percolation could push the effective CN to 0.10–0.15. ToR A stream gauging (18 months) is the highest-priority study before dam construction funding is sought.
- ·Install 2 stream gauges on Sheikh River (wet + dry season runs)
- ·Calibrate CN against measured flow events
- ·Reconcile GPM vs CHIRPS using rain gauge network
- ·Reduce MAR uncertainty from ±60% to ±15%
- ·Assess whether dam upsizing to FSL 1,445m is warranted at lower CN
- ·Confirm Q₁₀₀₀ design flood (currently Rational method, unverified)
RCC Gravity Dam — Structure
Geometry
Materials
Hydraulics
Outlet Works & Gravity Pipeline
Intake tower & conduit
| Component | Specification |
|---|---|
| Intake tower height | 35 m reinforced concrete tower |
| Bottom draw-off port | 1,400 m ASL (+5 m above thalweg) |
| Top port | 1,435 m ASL (= FSL) |
| Draw-off levels | 3 ports: environmental / operational / emergency |
| Outlet conduit | 2 × DN800 mm steel pipe (redundancy) |
| Conduit length | 80 m through dam body |
| Control valves | Butterfly + needle valve each barrel |
| PRV requirement | Pressure-reducing valve downstream — 35m head |
| Operating flow | 0.68 m³/s = 58,700 m³/day at net yield |
Gravity pipeline to Berbera
| Parameter | Value |
|---|---|
| Route | Sheikh Highland → Sheikh Pass → Berbera coast |
| Length | 100 km (road corridor alignment) |
| Diameter | DN1200 mm steel, FBE internal lining |
| Gravity head | 1,435 m (FSL to Berbera coast 0 m) |
| Pumping energy | Zero — full gravity |
| Design velocity | ~2.0 m/s (controlled by PRV at Berbera) |
| Max capacity | ~2.3 m³/s = 200,000 m³/day (hydraulic limit) |
| Operating capacity | 58,700 m³/day (21.3 Mm³/yr net yield) |
| Connection | SWRO intake header at Berbera desalination plant |
| Pipeline alignment | 100 km, road corridor, remote mountain |
This design is at pre-feasibility level (±30%). Key uncertainties: (a) actual valley width from LiDAR (±20% effect on crest length and RCC volume); (b) foundation rock quality from boreholes (±15% on grouting); (c) pipeline alignment survey (±10% on pipeline length). Bankable feasibility study with ToR A/B/C surveys will bring accuracy to ±10%.
Geotechnical & Environmental Notes
- Precambrian basement complex (typical Golis Range)
- Expected: Granitic gneiss / metamorphic rock
- Good bearing capacity: 3–5 MPa allowable
- Curtain grouting for seepage control
- Confirm by 3 × core boreholes at dam axis (ToR B)
- Gulf of Aden rift zone — moderate seismicity
- USGS: Mw 6.0 expected, Mw 6.5 MCE
- Dam designed for MCE 0.15g PGA
- Base width 0.70H provides seismic stability margin
- Full seismic hazard assessment required (ToR A)
- Highland plateau: very low population density
- No major settlements within reservoir footprint (est.)
- E&S budget (4%) covers ESIA + RAP
- Reservoir 7.84 km² — limited displacement impact
- Environmental flow: 0.2 m³/s minimum release
Path to Bankable Feasibility
| ToR | Study | Duration | Unlocks |
|---|---|---|---|
| ToR A | Hydrological study: stream gauges, flood analysis, seismic hazard | 18 months | MAR ±10%, design flood confirmed |
| ToR B | Geotechnical: 3 core boreholes at dam axis + UAV/LiDAR DTM | 12 months | Foundation design, reservoir volume ±10% |
| ToR C | ESIA + RAP: social census, environmental baseline, resettlement plan | 12 months | ADB/IDA/IsDB safeguard compliance |
| ToR D | Detailed engineering design (DED): dam, spillway, pipeline | 24 months | Tender-ready drawings, BOQ ±10% |
| — | Tender and award | 12 months | Construction start |
Reservoir Inundation Extent — FSL 1,435 m
The hatched blue area shows the 7.72 km² inundated at Full Supply Level (1,435 m ASL). Computed by flood-filling 90m DEM cells between thalweg (1,395 m) and FSL within the pysheds DAM-01 catchment boundary (439 km²). Toggle satellite imagery to assess terrain and land cover within the inundation footprint.